1. The problem
Research studies collect samples over time. A fixed reference lets them analyze additional samples without rebuilding the atlas. We tested this with public kidney data and retrospective patient holdouts, including an independent cohort, not a prospective longitudinal study.
The workflow returns a cell-type assignment or a recorded reason a cell could not be mapped, together with the reference version and execution record. We evaluated assignment quality separately.
What we tested
We used public kidney data from Dumoulin and colleagues to develop a reference, then evaluated eight internal held-out patient groups and an independent Xenium cohort from Baker, Kakade and colleagues covering acute interstitial nephritis, acute tubular injury, and reference kidney samples: 20 biopsies, 22 sections, and nine acquisition runs. Internal holdout and external patients were not used for selection or tuning.
The evaluation focused on eight broad kidney classes; predicting disease state was outside its scope. Injury states and finer epithelial subtypes were not evaluated separately. The question was whether a fixed procedure could map independent samples consistently, and where its cell-type assignments would still need review.
Why these methods?
The published atlas used staged scVI/scANVI models. We used that approach as the starting point for a new reference that could map patients without further fitting; we did not reuse the authors' fitted model. Residual-PCA provided a transparent control without cross-platform integration, using fixed nearest-centroid assignments.
Selection used mean patient-level macro-F1 on patients excluded from evaluation. For Xenium, negative binomial was selected from three scVI/scANVI count models (Poisson, negative binomial, and zero-inflated negative binomial). Residual-PCA was selected from the qualified baseline pool, which also included SingleR and scmap-cluster. Held-out and external results did not determine these choices.
This note covers Xenium. The broader analysis also tested CosMx; its required InSituType comparator with measured background remains pending because the necessary measured negative-probe counts were unavailable.
Why lock the reference?
Locking went beyond saving a model: we fixed genes and their order, preprocessing, cell-type definitions, fitted parameters, software, and permitted mapping operations. That defined the reference and procedure used for each patient, while leaving assignment quality as a separate question to evaluate; Figure 1 describes the workflow, and the results follow.
2. How we approached it
Analysis workflow
Patient allocation used control, diabetic kidney disease, and other-disease groups to support representation across reference building, selection, and internal evaluation. Disease labels were not mapper inputs or batch variables.
Once, to build the reference
1. Build
Define the reference
The kidney atlas from Dumoulin and colleagues, focused on diabetic kidney disease, supplied spatial data and 130,839 single-nucleus profiles from 24 donors. We used 4,777 shared genes and eight broad kidney classes.
2. Select
Choose configurations without evaluation patients
We chose configurations on patients excluded from evaluation, then refitted the reference without evaluation patients. The simpler comparison used reference-fitted Pearson residuals, 50-component PCA, and nearest cell-type centroids.
3. Lock
Fix more than model weights
Each method retained its genes and gene order, preprocessing, cell-type definitions, fitted parameters, software, and permitted mapping operations. This defines what can be reused without fitting again.
For every new sample
4. Map
Apply the reference to one patient
Inputs were raw counts and cell/patient identifiers. Required genes had a fixed order; samples missing required genes were rejected, not filled with zeros. Mapping used the saved model without training or fine-tuning.
5. Check
Verify the procedure and account for cells
Synthetic tests checked repeated runs, cell order, smaller processing batches, and whether mapping altered the reference; the final check was also performed when mapping real patients. Outputs retained source cell order, assignments, class scores, failure reasons, and a reference and execution record.
Once, in this study
6. Evaluate
Measure agreement and inspect errors in this study
Predictions were finalized before scoring. We examined patient-level macro-F1, pooled cell-type performance, and confusion patterns against the source annotations, comparing both locked methods. Reproducibility alone does not establish assignment quality.
What the reproducibility checks showed
Both Xenium methods passed tests using synthetic data to check consistency when repeating the analysis, changing cell order, or processing cells in smaller batches, and to verify that mapping did not alter the reference. The same unchanged-reference check was also performed when mapping real patients. For scVI/scANVI, compared probability arrays agreed within 1 × 10⁻⁶.
3. What we observed
Cell-type agreement
The reference remained unchanged during patient-by-patient mapping. The external workflow accounted for all 321,333 source cells. Scoring used 312,526 cells; 8,807 were excluded under prespecified annotation rules for ambiguous lineage labels, mixed cells, or low-quality annotations. These excluded cells remained in the mapping outputs.
Mapping status was a separate check: 62 cells had zero native-panel counts. Of these, 61 had eligible annotations and counted as errors in scoring; only one belonged to the 8,807 excluded cells. The workflow completed, but cell-type assignment quality was uneven.
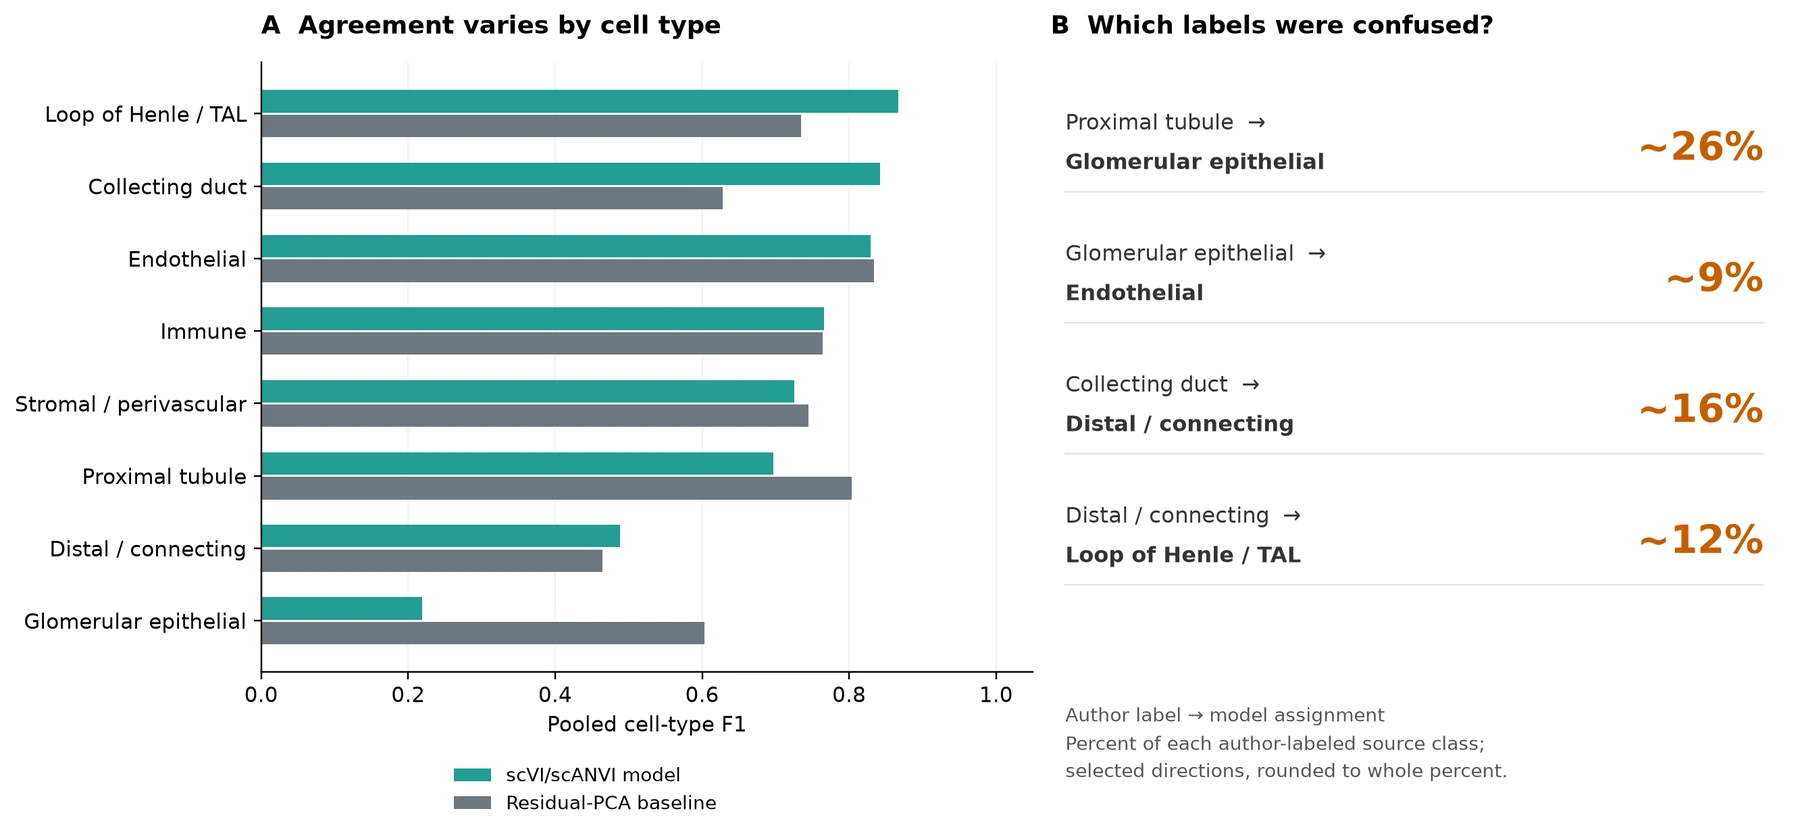
Six of eight broad lineages had pooled model F1 between 0.697 and 0.867. Loop of Henle/TAL, collecting duct, and endothelial cells had the highest values. Distal/connecting tubule reached 0.488, and glomerular epithelial cells reached 0.219.
The glomerular result was driven by overcalling. Only about 13% of cells assigned that label agreed with the authors' glomerular annotation. About 26% of author-labeled proximal tubule cells were assigned to the glomerular class. For a glomerular or podocyte-focused study, we would not use these model labels alone to select cells: independent checks of cell identity would be needed before interpreting that subset.
The distal/connecting boundary also deserves attention: about 16% of author-labeled collecting duct cells were assigned there, while about 12% of author-labeled distal/connecting cells were assigned to Loop of Henle/TAL. These directions identify concrete groups to review, rather than treating all errors as one problem.
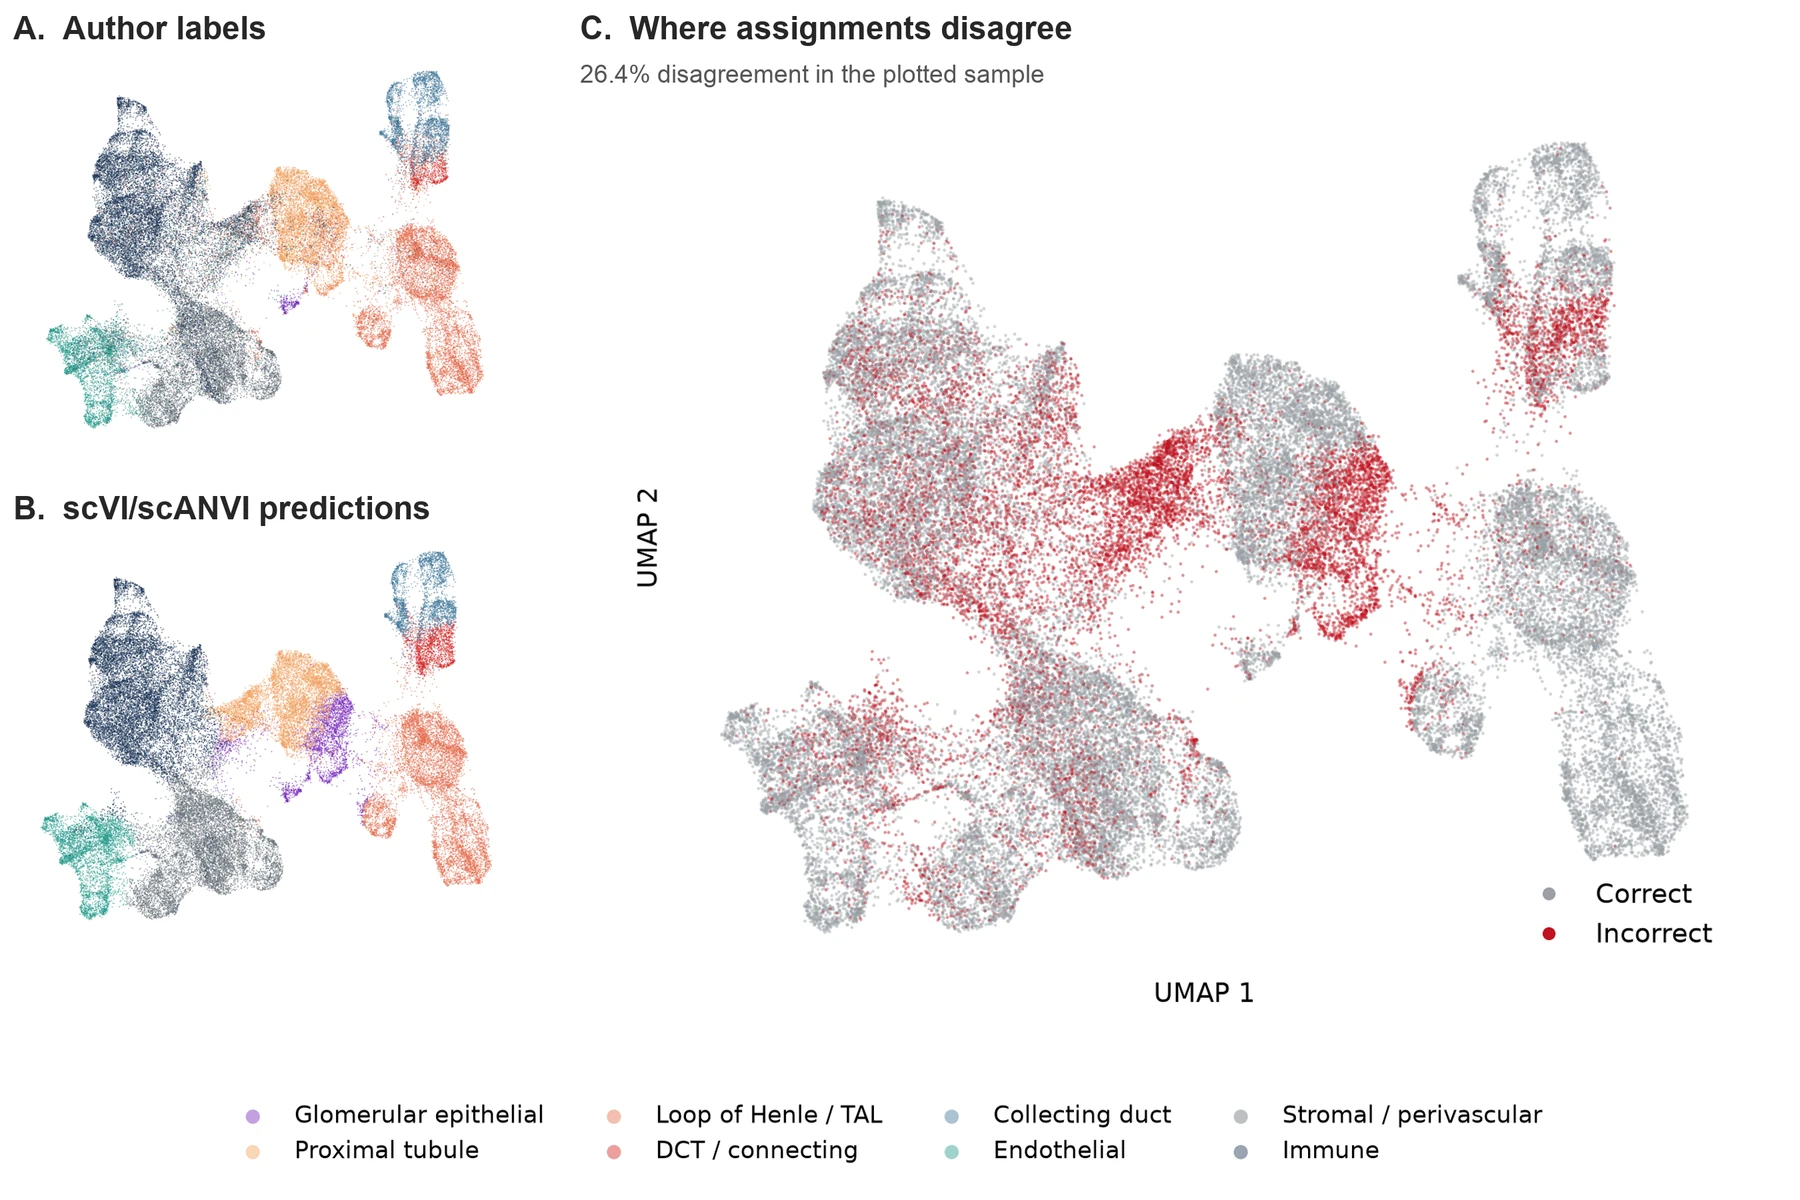
Seeing where the assignments agree
Comparison with the simpler locked method
The prespecified comparison calculated macro-F1 within each patient, then averaged across patients. It answers a different question from the pooled cell-type scores in Figure 2.
| Xenium evaluation | Patients | scVI/scANVI | Residual-PCA | Model minus PCA, 95% interval |
|---|---|---|---|---|
| Internal holdout | 8 | 0.798 | 0.800 | -0.001 [-0.038, +0.036] |
| Independent external | 20 | 0.584 | 0.593 | -0.009 [-0.029, +0.011] |
The external interval accounts for shared acquisition runs, so cells from the same run are not treated as independent evidence.
Residual-PCA scored slightly higher, but the 95% interval included no difference and small advantages for either method. The comparison therefore did not show that either method performed better or that the methods were equivalent.
Post hoc descriptive class-level diagnostic
Table 1 remains the primary evaluation of the complete eight-class task. To quantify the class-level differences shown in Figure 2, Table 2 reports a post hoc descriptive view of the same unchanged predictions. After inspecting the external results, we flagged the two classes with the lowest observed pooled F1 values for further investigation. This grouping had no prespecified cutoff. The unweighted mean of the remaining six original pooled one-vs-rest class F1 values was 0.788 (range 0.697-0.867). For context, the unweighted mean across all eight pooled class F1 values was 0.679. The gaps from 0.584 to 0.679 and from 0.679 to 0.788 reflect, respectively, changing from patient-level to pooled class-level estimation and then averaging only the six higher observed rows; neither is a rescore or performance gain. This is not a restricted-label rescore or a new six-class classification task: cells, labels, prediction outcomes, and errors involving the other two classes all remain in the original denominators.
| Post hoc flag | Broad class | Truth support | Precision | Recall | F1 |
|---|---|---|---|---|---|
| Investigate | Glomerular epithelial | 3,543 | 0.129 | 0.730 | 0.219 |
| Proximal tubule | 39,814 | 0.714 | 0.681 | 0.697 | |
| Loop of Henle / TAL | 66,013 | 0.947 | 0.800 | 0.867 | |
| Investigate | Distal / connecting tubule | 6,145 | 0.382 | 0.674 | 0.488 |
| Collecting duct | 20,639 | 0.924 | 0.773 | 0.842 | |
| Endothelial | 29,552 | 0.850 | 0.810 | 0.829 | |
| Stromal / perivascular | 79,773 | 0.829 | 0.644 | 0.725 | |
| Immune | 67,047 | 0.702 | 0.842 | 0.766 |
Post hoc descriptive analysis of the same frozen predictions used for the complete eight-class evaluation. Rows reproduce pooled one-vs-rest metrics across all 312,526 eligible cells; the diagnostic grouping was defined only after the external class-specific results were inspected and had no prespecified cutoff. The six-class mean is reported in the surrounding text rather than as a table total; it is not a restricted-label rescore or a new six-class classification task. The complete patient-level eight-class result in Table 1 remains primary.
Note. Precision uses all eligible cells assigned to a class; recall uses all eligible cells with that author-curated class label. Errors between the post hoc groups remain false positives or false negatives in the original class metrics, and eligible mapping failures remain errors. No cells, labels, predictions, mapping failures, false positives, or false negatives were removed or reassigned; no model was refit and no threshold was retuned. The source labels are a practical annotation target rather than independently adjudicated biological truth. These results describe transfer in this independent study and acquisition context only.
The higher pooled values provide evidence of stronger agreement for these classes in this independent Xenium study and acquisition context. They do not establish consistency across patients or generalization to other cohorts, panels, instruments, diseases, or biological settings. Glomerular epithelial and distal/connecting tubule remain visibly lower and require further investigation. Reference representation, panel differences, disease context, annotation differences, and model behavior are hypotheses to examine; the present results do not identify a cause.
Interpretive limit. The reported six-class mean was calculated after the class-specific results were inspected and is vulnerable to selection optimism. It is based on pooled cell-level class metrics, not equal-weighted patient-level class estimates, and has no confirmatory interval or decision threshold. It measures agreement with one study's author-curated broad labels and cannot establish biological truth, clinical utility, broad model generalization, or the cause of the two weaker class results.
What this does not tell us yet
Source annotations are an agreement target, not independently verified biological truth. Neither the scores nor UMAP establish clinical suitability; other panels and cohorts need separate testing.
4. Future Work
We would first investigate why proximal tubule cells were assigned to the glomerular class and why distal/connecting and collecting duct labels crossed. Marker profiles, tissue localization, and expert review could help separate measurement differences, reference representation, disease context, and annotation differences. These are hypotheses to test, not causes established by the current results.
The planned disease-group analysis remains future work. Using both methods’ existing predictions, we will examine cell-type precision, recall, and error patterns by patient and disease group. Small groups and sample or acquisition differences may limit interpretation; associations would not establish causation.
The simpler locked method remains active. Its fixed residual projection and nearest-centroid assignment are computationally simpler than scVI/scANVI mapping, but runtime and memory still need direct measurement. Any revision would be developed separately and tested on additional untouched patients. The aim is to improve poorly resolved populations while keeping a traceable, repeatable procedure for each patient.
Considerations when evaluating a reference-based approach
| Question | What to check |
|---|---|
| What exactly is locked? | Reference version, input genes, preprocessing, cell-type definitions, fitted parameters, and software versions. |
| Can a new sample change the analysis? | Whether refitting is allowed, whether the reference stays unchanged, and whether repeating, reordering, or processing cells in smaller batches changes the results. |
| What happens to every cell? | An assignment or failure reason in source order, with totals that reconcile to the input and clear evaluation exclusions. |
| Which populations can support my question? | Cell-type precision and recall, confusion patterns, whole-patient evaluation, a credible baseline, and uncertainty in the comparison. |
Sources
1. Dumoulin et al. Spatial atlas of diabetic kidney disease reveals a B cell-rich subgroup. Nature, 2026. Source study.
2. Baker, Kakade et al. Spatial analysis reveals the cellular microenvironments and mechanisms of inflammation and kidney injury in acute interstitial nephritis. bioRxiv, 2025. Source study. External data: GSE336890 and Zenodo 21793755 v2.
3. Lopez et al. Deep generative modeling for single-cell transcriptomics. Nature Methods, 2018. scVI.
4. Xu et al. Probabilistic harmonization and annotation of single-cell transcriptomics data with deep generative models. Molecular Systems Biology, 2021. scANVI.